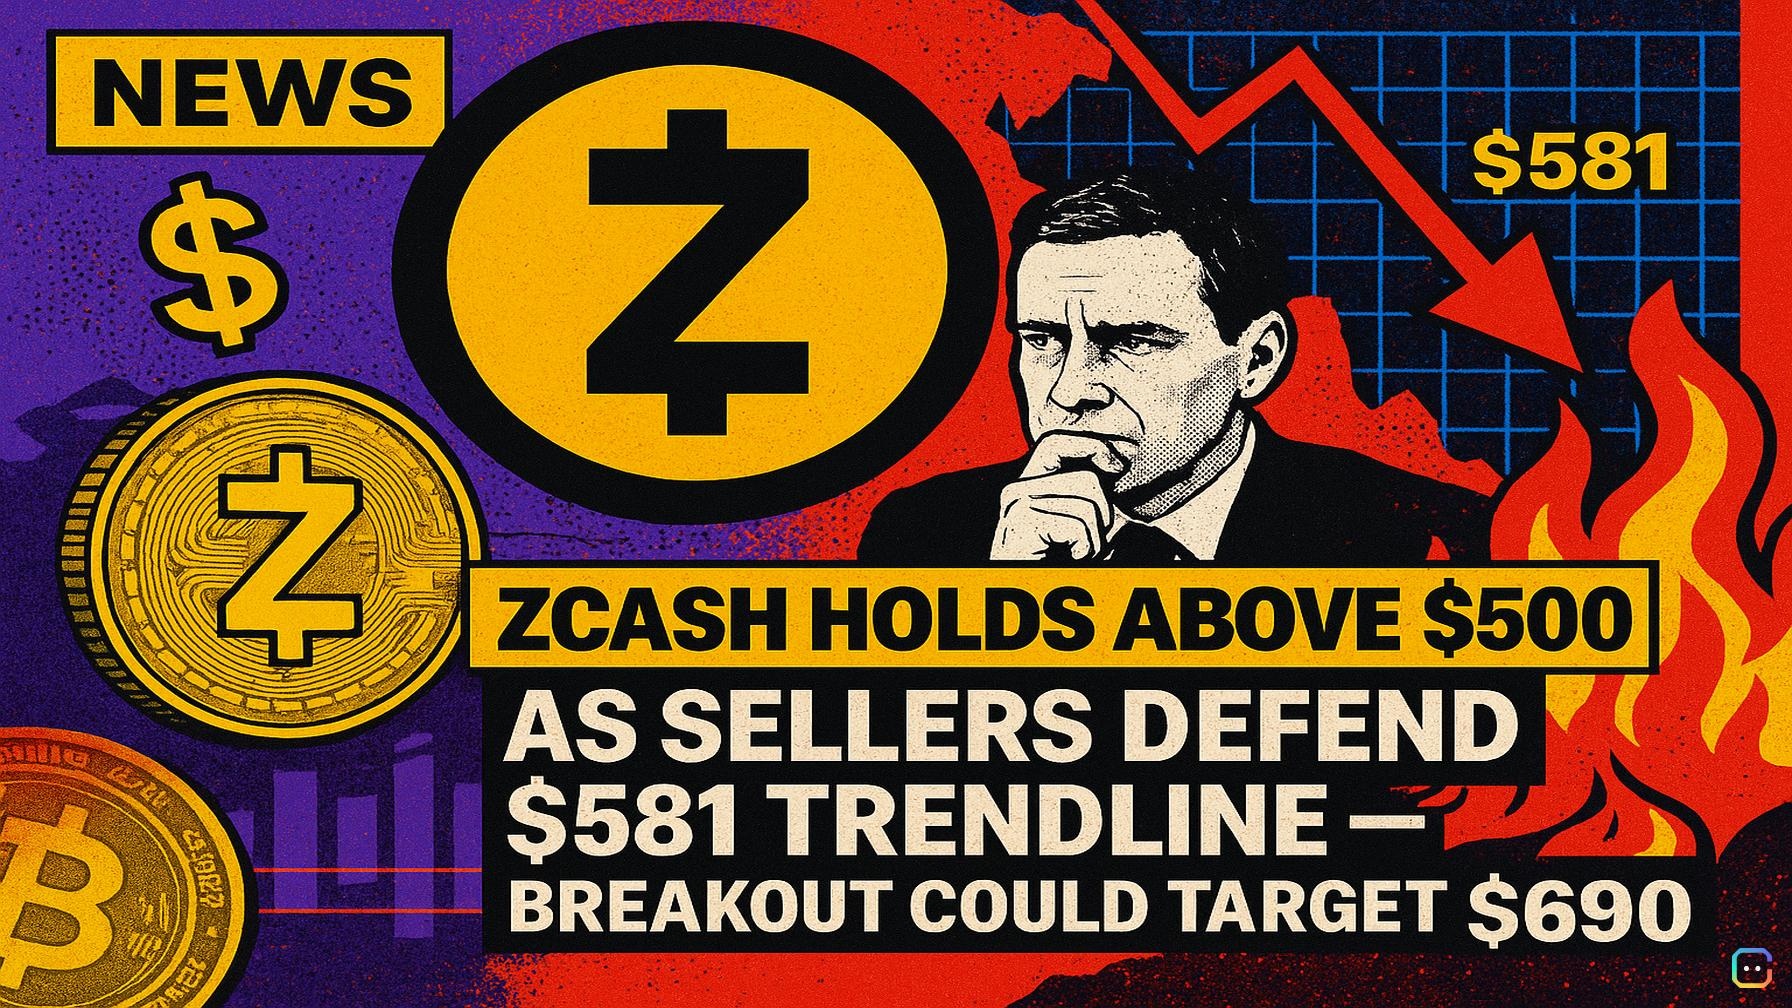
Zcash (ZEC) extended a near-term pullback on Thursday but held above the $500 mark as sellers continued to defend a key descending resistance line — keeping the token in a consolidation phase rather than reversing its longer-term uptrend.
Price action: sellers defend trendline
ZEC has run into persistent resistance at a descending trendline near $581. Multiple rejections there show sellers remain active on rallies, capping upside for now. If bulls can clear that trendline convincingly, the door opens for a potential retest of the previous swing high around $690. Until that happens, rallies are likely to be met with supply.
Support structure still intact
Despite the pullback, Zcash is trading above two important moving averages: the 50-day EMA at $489 and the 200-day EMA at $407. Holding above those levels suggests the broader bullish structure is still intact and that longer-term buyers remain in control — even as short-term momentum cools.
Momentum: neutral to slightly bearish
Momentum indicators point to a balanced near-term picture. The RSI sits around 52 — essentially neutral and signaling no clear dominance by buyers or sellers. The MACD has slipped below zero, indicating that bullish momentum has weakened and downside pressure has increased. That said, the overall set-up remains constructive so long as the key EMAs hold.
Key levels to watch
- Immediate resistance: descending trendline near $581 — a decisive break above would boost the bullish case and could set up a move toward the prior high near $690.
- Immediate support: 50-day EMA at $489 — a sustained break below this level could invite further selling.
- Longer-term support: 200-day EMA at $407 — a likely buyer zone if corrections deepen.
Outlook
Zcash remains in a healthy long-term uptrend despite the recent pullback. Near-term momentum has softened, and the $581 trendline is capping gains, but maintaining levels above the 50- and 200-day EMAs keeps the broader bullish thesis intact. Traders will be watching for a clean breakout above the descending trendline for confirmation of renewed upside or a loss of the 50-day EMA for signs of a deeper correction.
Read more AI-generated news on: undefined/news