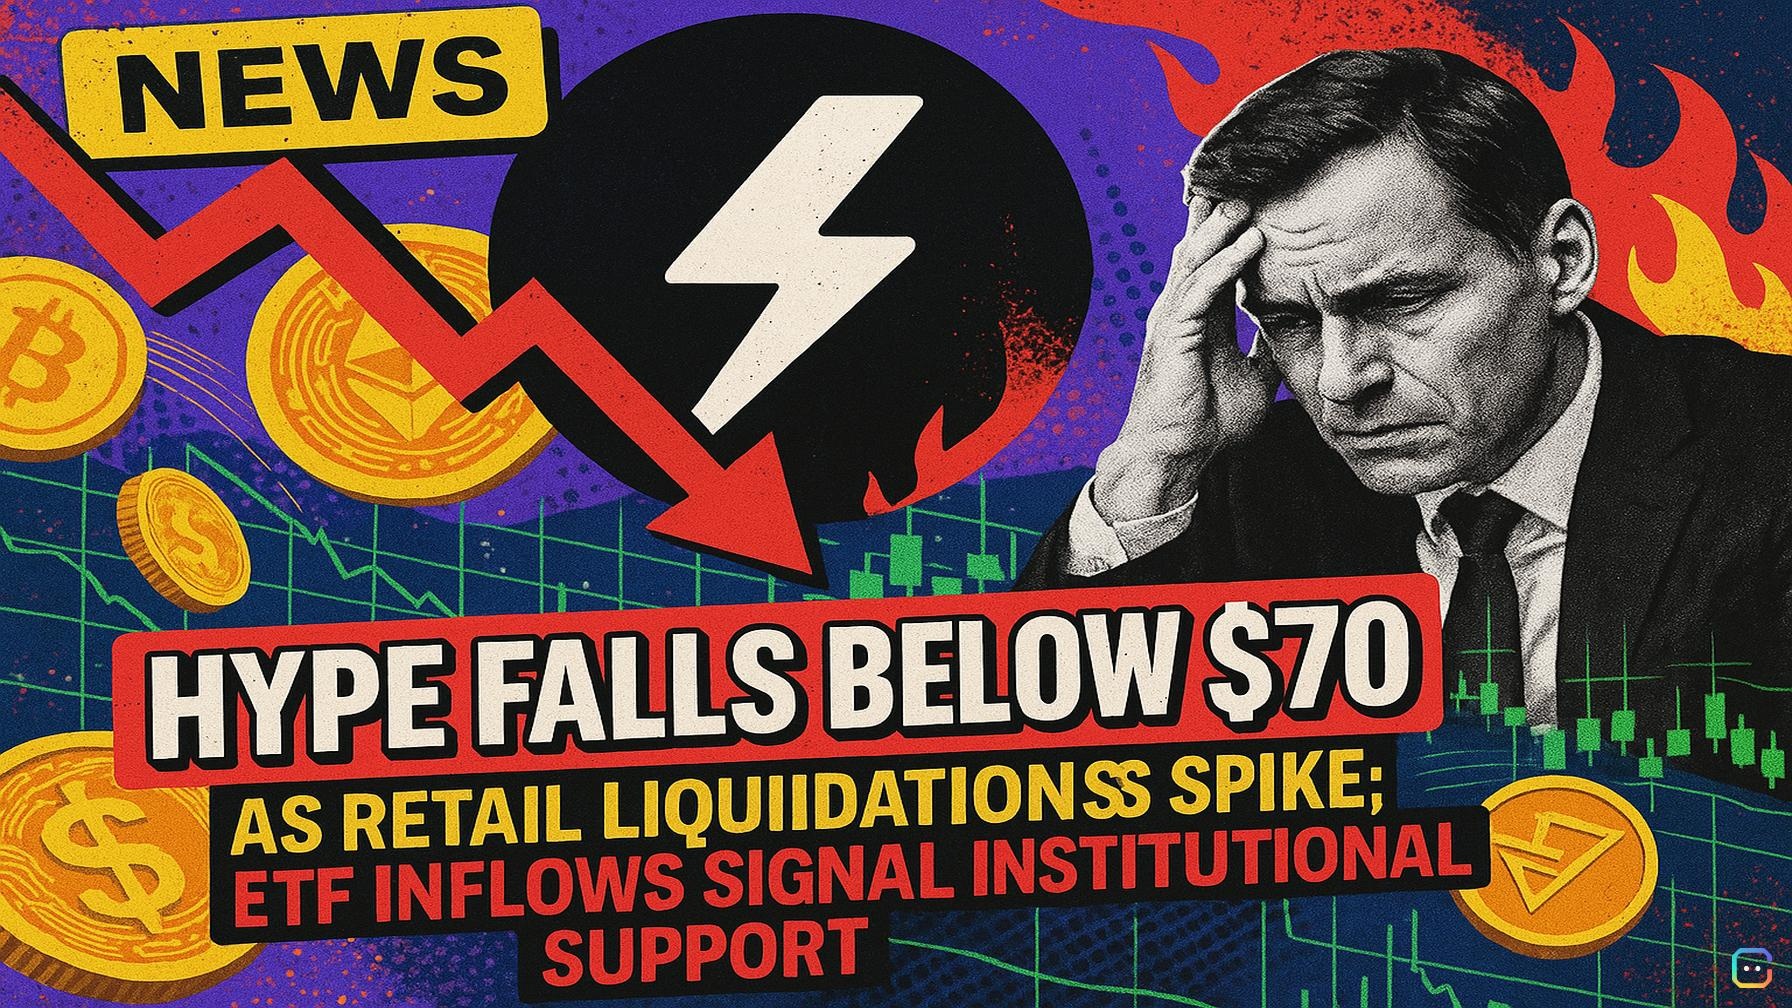
Hyperliquid (HYPE) slid back below $70 on Wednesday, marking a third straight day of losses as cautious market sentiment has trimmed retail participation. While short-term traders appear to be stepping back, larger investors are still adding exposure — a divergence that could shape the token’s next directional move.
What happened
- HYPE traded around $68 at the time of writing, down after being rejected at a local resistance near $72.75.
- The token’s pullback has driven short-term selling pressure, but its longer-term bullish structure remains intact: the 50-day EMA sits at $62.36 and remains above the 200-day EMA at $48.40.
Derivatives show waning retail demand
- Hyperliquid futures open interest (OI) fell by more than 2% in 24 hours to $2.80 billion, per CoinGlass — a sign traders are reducing leverage or closing positions.
- The market recorded $7.09 million in liquidations over the same period, roughly $6.29 million of which were long positions. The predominance of long liquidations indicates bullish retail traders were forced out as prices fell.
- Despite this, the funding rate remains positive at 0.0078%, meaning some longs are still willing to pay a premium to remain positioned.
Institutions keep buying
- Institutional flows tell a different story: Hyperliquid exchange-traded funds (ETFs) saw $8.43 million in inflows on Monday and another $4.32 million on Tuesday, according to CoinGlass.
- Continued ETF inflows suggest larger investors remain optimistic about Hyperliquid’s longer-term outlook even as retail appetite softens.
Technical outlook: key levels to watch
- Near-term support: a rising trendline around $64.75 — reinforced by the 50-day EMA at $62.36 — is the first major support zone. A decisive break below these levels could open the door to a deeper correction toward $60.
- Resistance: bulls need to reclaim the $72.75 zone (the recent descending trendline). Clearing this could accelerate a move toward the R1 pivot at $77.09, and then toward R2 at $89.14.
- Momentum: the MACD sits slightly above its signal line, so bullish momentum hasn’t fully faded, while the RSI is around 54 — indicating moderate buying strength but a drift back toward neutral.
Bottom line
Short-term weakness in HYPE is driven largely by reduced retail leverage and long liquidations, but persistent institutional inflows are providing a stabilizing force. Traders will be watching $64.75–$62.36 for downside support and $72.75 for any sign of renewed bullish momentum.
Read more AI-generated news on: undefined/news