Today's Cryptocurrency Prices by Market Caps
The global cryptocurrency market cap today i $2.35T
Market Cap
$2.35T
24h Trading Volume
$141.09B
BTC Dominance
56.47%
|
#
|
Name
|
Price
|
1h %
|
24h %
|
7d %
|
Market Cap
|
Volume (24h)
|
Chart (7d) |
|---|---|---|---|---|---|---|---|---|
|
|
—
|
|||||||
|
No cryptocurrencies found Try adjusting your search query |
||||||||
Latest Crypto News
View All News
Crypto Payments Catching On: 1 in 5 UK SMEs Report Customer Interest, Especially Larger Firms
One in five top UK SMEs report customer interest in crypto payments — and that figure jumps among larger firms, a new DECTA whitepaper finds. A survey of 500 UK SME decision‑makers by Censuswide (fieldwork: March 13–20, 2026), published by payments tech provider DECTA, shows cryptocurrency is emerging as a niche but growing payment preference — especially for higher‑turnover and internationally active businesses. Key findings - 11.8% of UK merchants say customers want the option to pay with cryptocurrency. - That share rises to 20.7% for companies with annual turnover of £50m–£99.99m. - When merchants ranked customer payment priorities, crypto came eighth (11.8%), behind payment security (48.6%), simplicity (42.2%), speed (37.2%), multiple payment options, refunds, guest checkout, and Buy Now Pay Later (BNPL). BNPL alone was a top priority for nearly 20% of respondents. - Larger firms showed more interest in both open banking and crypto. DECTA concludes that payment providers that ignore crypto risk being viewed less favourably by some of their largest merchant customers. Cross‑border trade and operational pain points - 53.8% of surveyed SMEs already sell worldwide. - 20.2% of merchants engaged in international trade said their cross‑border payments experience has worsened. - Top business pain points were slow access to funds (19.4%), fraud and security concerns (16%), and opaque payment processing fees (14.2%). - Security matters most overall: 51.8% of merchants would prioritise security over both lower fees and access to the latest payment tech — rising to 62.1% among micro‑businesses (1–9 employees). Industry view and regulatory backdrop DECTA CEO Scott Dawson, who also chairs the Payments Innovation Forum, told crypto.news that alternative payment methods are gaining traction among merchants. The firm’s analysis frames crypto as a minority but meaningful option — particularly for high‑turnover and globally active firms. That commercial interest comes amid heightened regulatory scrutiny in the UK. The Financial Conduct Authority (FCA) recently warned football clubs about sponsorships with unauthorised crypto firms and is progressing its crypto regulatory framework: firms will be able to apply for authorisation from September 30, 2026, with the full cryptoasset regime taking effect on October 25, 2027. In May, UK authorities sanctioned Huobi Global S.A. (linked to HTX) as part of an enforcement action tied to the A7 network, following FCA legal action against HTX over alleged unlawful promotions to UK consumers. What it means DECTA’s report paints crypto payments as a specialist but growing feature of the UK SME payments landscape — one that matters most to larger, internationally trading merchants. For payment providers and platforms, the takeaways are clear: speed, security and simplicity remain dominant customer demands, but refusing to accommodate crypto could be a competitive drawback when serving bigger merchants with global footprints. Read more AI-generated news on: undefined/news

BTC, ETH Slip Below 'Max Pain' After $2.13B Options Expiry — Traders Turn Cautious
Bitcoin and Ether absorbed a $2.13 billion options expiry on June 19, and the outcome underlined growing trader caution as both tokens sat below their “max pain” levels. The numbers - Total notional: $2.13 billion expired across BTC and ETH options. - Bitcoin: 31,000 options, put-call ratio 0.78, notional ~$1.9 billion, max pain $65,000. BTC traded around $62,500 during the session — below that pain point. - Ethereum: 138,000 options, put-call ratio 1.03, notional ~$230 million, max pain $1,725. ETH traded near $1,690, also under its max pain. Why it matters Max pain is the strike price where option buyers collectively lose the most value at expiry; when price sits below that level it tends to amplify cautious positioning. This expiry reinforced two key technical ranges traders have been watching: $60,000–$63,000 for Bitcoin and roughly $1,700 for Ether. Near-term market dynamics - Bitcoin: After a brief rebound to about $67,000 earlier in the week, selling pressure pushed BTC below $63,000 ahead of expiry. Analytics firm GreeksLive flagged the $60,000 strike as a “critical threshold,” noting that a sustained break beneath it could flip dealer hedging from stabilizing to directionally reinforcing — accelerating downside moves. Open interest remains bi-modal: lots of longer-term upside exposure clustered near $80,000, while bearish protection concentrates near $60,000, highlighting the tug-of-war between upside bets and short-term defensive positioning. - Ether: With ETH below its $1,725 max pain, failing to reclaim the $1,700 area could keep downward pressure toward the $1,650–$1,600 range. Volatility and dealer flows Derivatives desks have seen a “week of grinding calm,” according to Laevitas: short-dated implied volatility has fallen (seven-day ATM IV dropped from roughly 46 to 36) while longer-dated back-end vol stayed near 43. That has flattened the fear front and left the market skew negative — traders still pay a premium for downside protection. The takeaway: if BTC holds above $60,000, volatility may stay muted; a break below could spark faster hedging flows and a sharper test of support. Fund flows and headline noise Institutional selling pressure has been a recurring theme. Strategy (formerly MicroStrategy) drew headlines after a small BTC sale earlier this month, but analysts argue that ETF outflows and whale selling were larger drivers of recent weakness. Still, the Strategy narrative has added to the market’s fragile confidence, at a time when demand from spot Bitcoin ETFs — a major institutional source since their launch — has cooled during the pullback. What’s next This expiry was smaller than last week’s, but the quarterly options settlement on June 26 is the next focal point — roughly 15% of options positions are slated to expire then, making next week a potential volatility inflection. For now, traders remain cautious: both BTC and ETH trading below their pain points signals limited conviction ahead of the larger quarterly reset. Disclosure: This article is for informational purposes only and does not constitute investment advice. Read more AI-generated news on: undefined/news
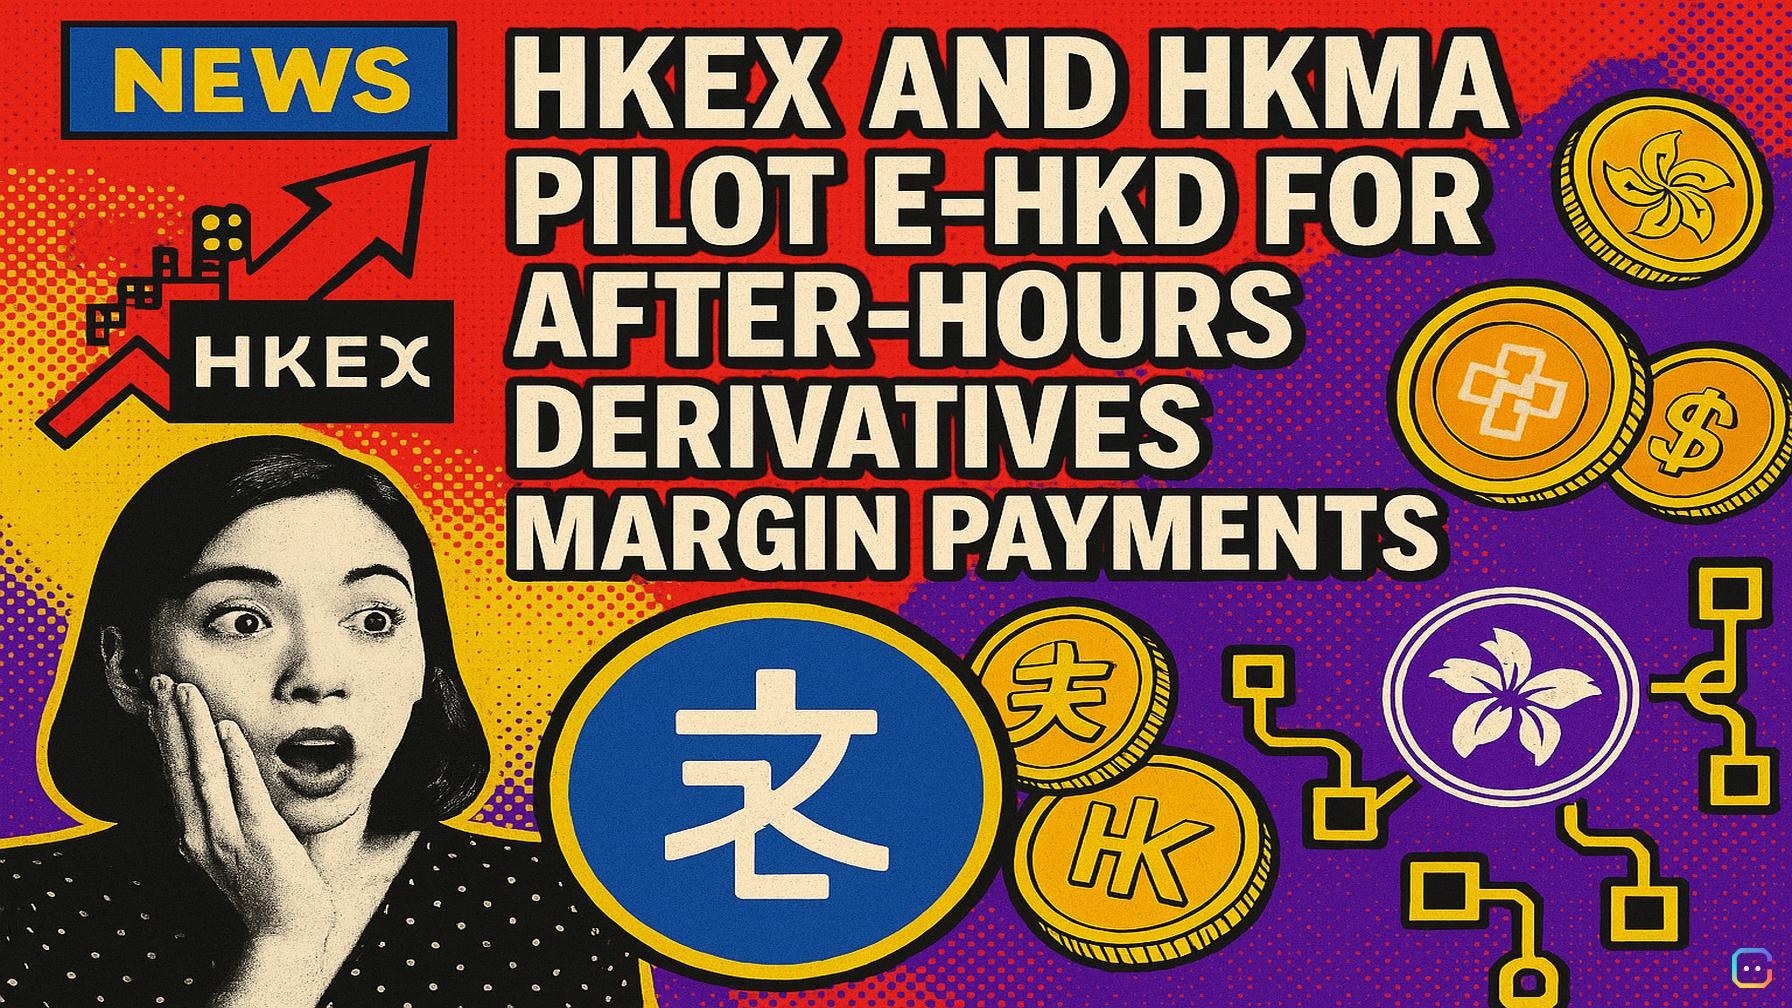
HKEX and HKMA pilot e‑HKD for after‑hours derivatives margin payments
Hong Kong’s market operator and central bank have kicked off a live pilot to use e-HKD — the city’s wholesale central bank digital currency — for after-hours derivatives margin payments, marking a notable step toward putting CBDC into core financial plumbing. What’s happening - Hong Kong Exchanges and Clearing (HKEX) and the Hong Kong Monetary Authority (HKMA) are testing whether e-HKD can be used by clearing participants to transfer margin outside normal banking hours, specifically to cover the after-hours trading (AHT) session in the derivatives market. - The pilot lets clearing participants under HKFE Clearing Corporation take part in voluntary, real-value trial transactions. Any broader rollout would still need regulatory approvals and assessments of market readiness and operational impacts. Why it matters - Today, clearing participants must submit advance margin deposit requests by 3 p.m. for funds to be recognized for the following AHT session — an operational constraint that limits liquidity and risk management after banks close. Using an around-the-clock wholesale CBDC could remove that cut-off, enabling more timely margin transfers and strengthening risk controls during extended trading windows. - The project is one of the clearest real-world deployments of e-HKD for institutional financial infrastructure rather than consumer payments, signaling Hong Kong’s pivot toward wholesale CBDC use cases like tokenized markets and trade settlement. Voices from HKEX and HKMA - Vanessa Lau, HKEX Chief Operating Officer, framed the initiative as a way to offer “a more flexible and timely payment option outside of regular business hours,” reduce long-standing operational pain points, and boost market resilience while reinforcing Hong Kong’s international financial hub status. - Howard Lee, Deputy Chief Executive of the HKMA, said the pilot will show how a wholesale CBDC performs in a live market environment. Background and context - The pilot follows the HKMA’s 2025 second phase of digital currency trials, after which regulators prioritized institutional applications. That earlier work concluded that e-HKD and tokenized bank deposits can enable programmable, cost-effective transactions across financial services. - Authorities reported stronger institutional demand than retail interest for e-HKD, prompting a strategic shift toward wholesale deployments. This HKEX project applies that strategy directly to derivatives margin funding during after-hours trading — a practical and high-impact use case. What to watch next - Results from the real-value trials will determine technical feasibility and operational implications. Any expansion beyond voluntary trials will hinge on regulatory approval, industry uptake, and integration with existing clearing and settlement processes. - If successful, the pilot could set a precedent for other financial markets to use wholesale CBDCs to extend operating hours, improve liquidity management and modernize settlement infrastructure. Bottom line: Hong Kong is moving from CBDC experimentation to practical, institutional applications. By testing e-HKD for after-hours derivatives margin payments, HKEX and the HKMA are exploring a concrete way a wholesale CBDC could remove operational frictions and strengthen market resilience. Read more AI-generated news on: undefined/news

Strive CEO: Forced Liquidations, Not Credit Risk, Drove STRC and SATA Selloff
Strive CEO Matt Cole called Wednesday “the most difficult day in the history of Digital Credit” after a sharp intraday selloff in two of the company’s Bitcoin-backed income products, STRC and SATA, that Cole and others say was driven by forced liquidations rather than a deterioration in credit quality. STRC plunged as low as $82.50 before rebounding, while SATA fell from par into the low $90s — hitting an intraday low of $92.88, according to Jeff Walton — and later recovered to about $97.71. Cole described the move on X as “a leverage liquidation event,” saying it reflected forced selling from leveraged investors rather than any change in the underlying credit fundamentals. He added that Strive’s dividend reserves remain intact and the firm is not under stress. These products sit inside a nascent market for preferred-equity-style digital credit, which blends income-focused securities with Bitcoin treasury strategies and public-market structures. That structure can amplify returns — and risks — when investors borrow against perceived stable assets. Cole compared the episode to traditional finance income-market stress, where margin calls and deleveraging can push prices far below fundamentals before buyers step back in. Cole said selling became disconnected from the credit profiles of the instruments, and noted there was strong demand near the intraday lows as buyers stepped in. “A liquidation event and a credit event are not the same thing,” he wrote, emphasizing that Strive remains able to meet its obligations. Key context: Strive listed SATA on Nasdaq as part of its Bitcoin treasury and digital credit strategy, raising $160 million in a 2 million-share IPO. After the listing, Strive reported holding 7,525 Bitcoin. SATA is a variable-rate preferred-equity product the firm says is aimed at growing Bitcoin per share over time. Strive targets SATA trading in a $99–$101 range; the product carries a 13% annual dividend and moved to business-day dividend payments starting June 16. The episode underlines how quickly income and preferred-style products can move when leverage and thin liquidity collide. A drop below par can attract buyers, but it also raises fresh questions about liquidity, leverage, market depth, and how these instruments behave under stress in a still-small market. For now, Strive’s message is stability: reserves intact, credit profile unchanged. The next test for investors is whether STRC and SATA can hold their recovery as liquidation pressures ease. Sustained trading near SATA’s $99–$101 target would support Strive’s stated market objectives; renewed volatility would keep leverage and liquidity risk in the spotlight for digital credit products. Read more AI-generated news on: undefined/news

Japan’s FSA bars moomoo from new accounts for 3 months over NISA, AML and cyber failures
Headline: Japan’s FSA bars moomoo Securities from opening new accounts for three months after wide-ranging compliance failures Japan’s Financial Services Agency (FSA) has ordered moomoo Securities — the Japanese arm of Nasdaq-listed Futu Holdings — to stop soliciting and accepting new account applications from June 19 through Sept. 18, and slapped the broker with a business improvement order after regulators uncovered major gaps in compliance, customer protection, anti-money‑laundering (AML) controls and cybersecurity. Key findings and actions - New‑account freeze: moomoo cannot solicit or accept new accounts for three months (June 19–Sept. 18). - Business improvement order: the firm must clarify executive accountability and submit a detailed remedial plan to the FSA by July 21. - Root cause: Japan’s Securities and Exchange Surveillance Commission (SESC) found moomoo expanded services and rolled out new products without adequate compliance or risk-management systems. What regulators found - NISA mislabeling: Between early 2025 and early 2026, moomoo’s mobile platform showed 78 U.S. ETFs and ETNs as eligible for Japan’s Nippon Individual Savings Account (NISA) tax benefits, even though those products did not qualify. Retail investors bought products believing they were tax‑advantaged. Regulators said moomoo failed to proactively notify affected customers or restore lost annual NISA allowances. - Restrictions on transfers: Since early 2024, the brokerage reportedly declined customer requests to transfer domestic Japanese stocks to other brokerages, limiting clients’ mobility. - AML lapses: More than 1,500 rejected or flagged account applicants were not sufficiently screened for suspicious activity because moomoo believed screening applied only to approved accounts. The company also neglected required examinations and reporting for suspicious transactions over an extended period. - Cybersecurity shortcomings: Management did not maintain a full inventory of key transaction systems and failed to properly assess vulnerabilities in critical infrastructure. Context and implications Moomoo Securities is part of Futu Holdings, a Hong Kong-based online brokerage that has grown quickly in Japan via its mobile trading app — surpassing 2 million downloads — by promoting low-cost access to U.S. stocks. The FSA’s enforcement underscores Japanese regulators’ increased scrutiny of digital finance platforms as they expand services. The action also comes amid broader tightening of crypto and digital-asset rules in Japan: earlier this year the FSA proposed tougher standards for stablecoin reserves and added supervisory requirements for institutions involved in crypto services. Related: Futu’s crypto arm, moomoo Crypto (a separate subsidiary), has been expanding in the U.S., recently launching crypto trading in Texas in addition to operations in California, New Jersey and Pennsylvania. The U.S. platform lists 52 digital assets and supports direct transfers between external wallets and customer accounts — a business line that could face reputational scrutiny as regulators press for stronger controls across the group. What’s next Moomoo must submit a business improvement plan by July 21 and demonstrate stronger governance, AML screening, customer remediation and cybersecurity controls to satisfy the FSA. The three‑month new‑account freeze remains in effect through Sept. 18 unless regulators change course. Read more AI-generated news on: undefined/news

Franklin Templeton Files ETFs That Reinvest U.S. Stock Dividends Into Bitcoin
Franklin Templeton has filed to launch two exchange-traded funds that would automatically redirect U.S. stock dividend income into Bitcoin exposure — a move that blends traditional equity investing with crypto allocation. Key details - Product names: Franklin US Equity Bitcoin DRIP Index ETF and Franklin US Innovation Bitcoin DRIP Index ETF. - Filing date and timing: Registration submitted Thursday with an anticipated effective date of Sept. 1, 2026. - Indexes tracked: VettaFi US Large‑Cap 500 Bitcoin DRIP Index and an innovation‑focused variant. - Dividend treatment: Under the index methodology, dividends from the underlying stock portfolios would not sit in cash or be paid out. Instead, they would be reinvested into Bitcoin‑linked instruments. - Allowed Bitcoin instruments: Spot Bitcoin ETPs, futures contracts, options or other investment vehicles could be used to gain crypto exposure. - Initial allocation and caps: Portfolios would start with roughly 95% U.S. large‑cap equities and 5% Bitcoin exposure. Quarterly rebalancing would trim any Bitcoin allocation above 5% back to 4.5%, and a separate limit would cap Bitcoin exposure at 20% between rebalancing events. - Index composition: As of April 30, the equity index held about 498 securities with market caps ranging from roughly $7.5 billion to $4.9 trillion. Why it matters The proposed ETFs would effectively turn dividend flows from large‑cap U.S. stocks into ongoing Bitcoin exposure, offering a built‑in, passive mechanism for investors who want to maintain equity exposure while accumulating crypto. That structure could appeal to investors looking for a hybrid equity/crypto allocation without manually buying Bitcoin. How this fits Franklin Templeton’s crypto push The filing expands Franklin Templeton’s growing digital‑asset product lineup, which already includes spot crypto ETFs, tokenized funds and blockchain‑native investment products. Data from SoSoValue shows Franklin’s spot Bitcoin ETF, ticker EZBC, held $358.9 million in net assets and had $329.6 million in cumulative net inflows as of Thursday. Recent related moves by Franklin Templeton - June 15: Announced a partnership with Ondo Finance to offer tokenized versions of its ETFs that can trade 24/7 directly from crypto wallets for investors outside the U.S., covering U.S. equities, fixed income and gold. - Early June: Integrated its BENJI tokenized money market fund into MoonPay Trade, enabling institutional clients to swap stablecoins (USDC, USDT) for BENJI on‑chain. - May: Partnered with Payward (Kraken’s parent) to make BENJI available on Kraken as a collateral and cash‑management product for institutions and to develop more tokenized investment products via Payward’s xStocks infrastructure. What to watch Regulatory clearance and the funds’ eventual launch details (fees, exact mechanics for converting dividends into specific Bitcoin instruments) will be key. If approved, these ETFs would be another sign that traditional asset managers are experimenting with ways to integrate crypto into familiar investment wrappers. Read more AI-generated news on: undefined/news