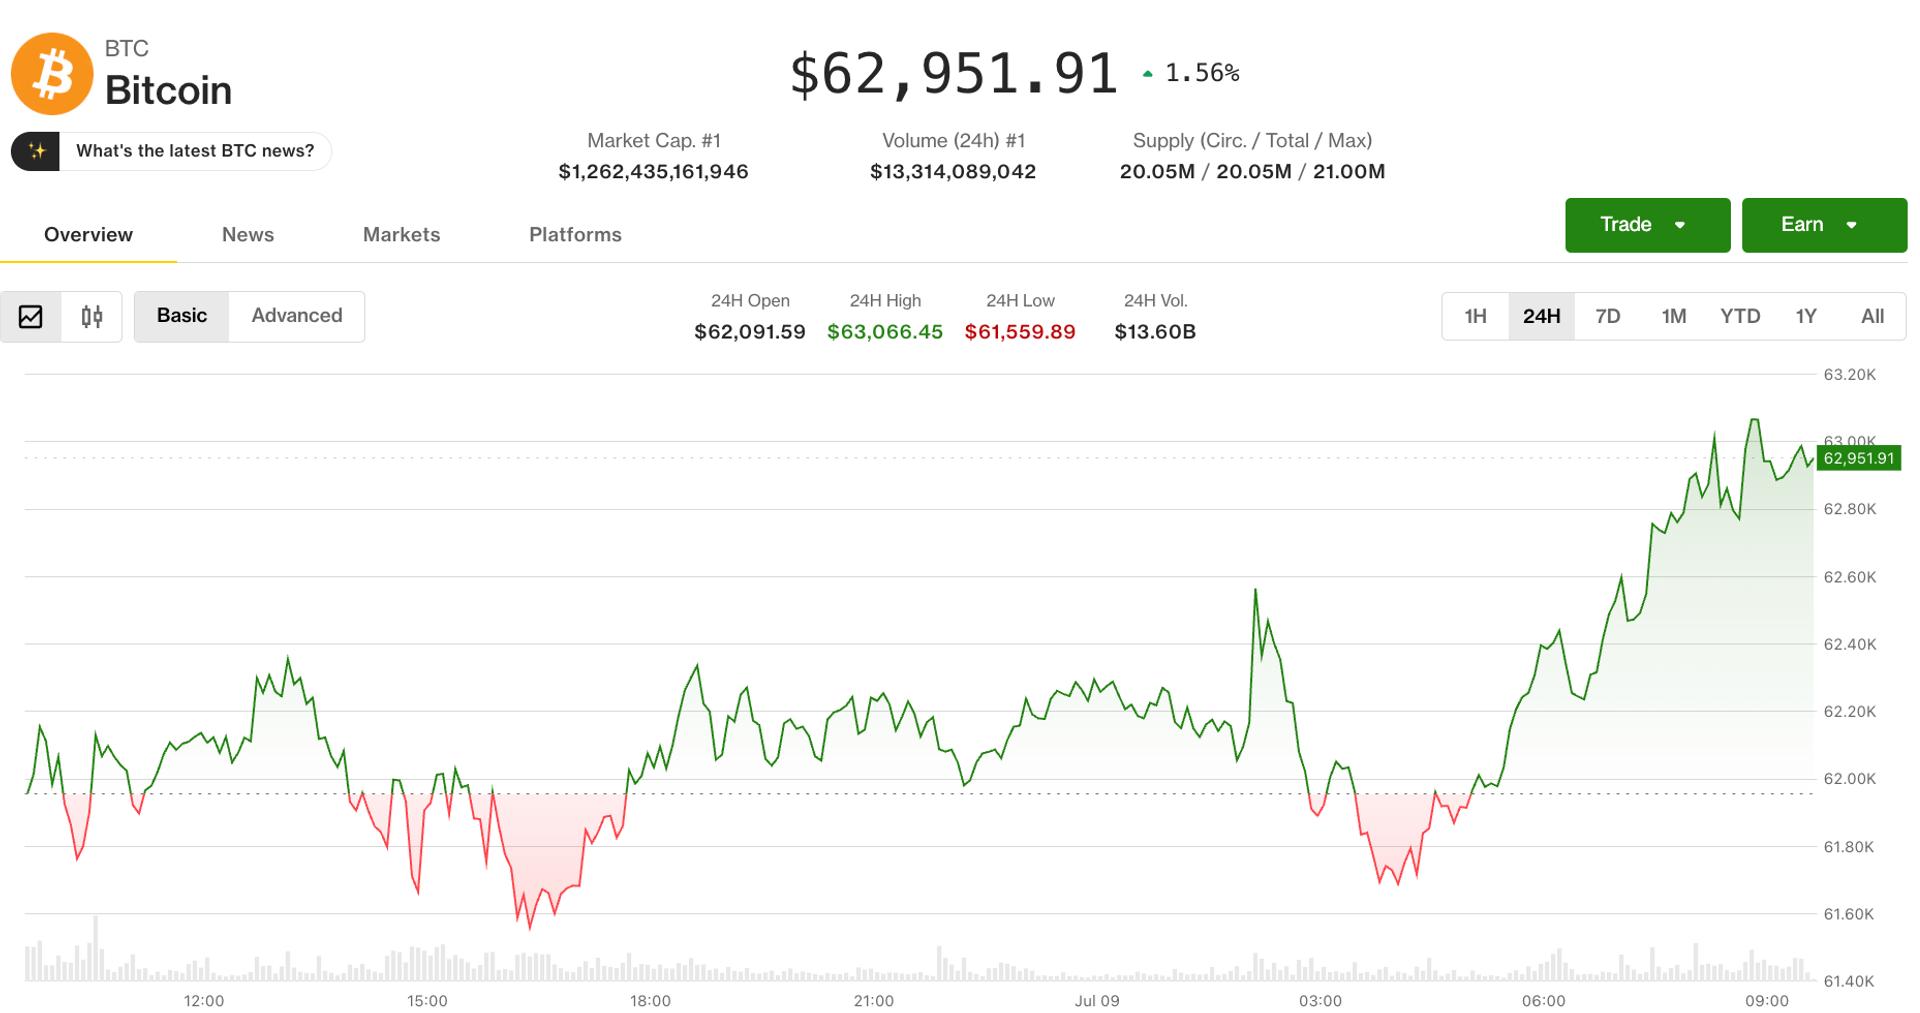
Crypto markets limp into the second week of July, with prices under pressure and sentiment bruised. Bitcoin is clinging to the low $60,000s after briefly sliding below $58,000 — a 21-month low — last week. Ethereum sits under $1,750 and is down roughly 4% for the day and more than 30% year-over-year. Altcoins have fallen even harder: the total crypto market cap outside BTC and ETH is off about 30% since January. Fresh public listings haven’t helped morale either—recent crypto IPOs from Gemini, Bullish and BitGo have underperformed since debuting.
Still, history shows panic can set the stage for the next major move. Every major Bitcoin bear cycle since 2009 finished with a deep flush and extreme fear readings before a new leg up. A “pre-halving compression” — lower prices and worsening sentiment before the supply shock — has preceded previous rallies. The next Bitcoin halving, which will cut mining rewards in half, is roughly 21 months away, a window that historically marks the beginning of accumulation. The big difference this cycle: Bitcoin’s institutional profile is fundamentally altered. Spot BTC ETFs, broader institutional balance sheets, formal accounting changes and clearer digital-assets rules mean this bear market has different participants than past ones. That doesn’t remove volatility, but it changes the dynamics of how bottoms form.
Bitcoin: teetering, not yet broken
- Price action: Bitcoin opened the week around $63,587, touched a high near $64,657, then slid to trade near $61,749 (down ~2.9% for the week). A low at $58,035 earlier in the week marked the 21-month trough.
- Key resistance: The $64–65K band has acted as a ceiling since June; this week’s rally “kissed” that zone then reversed.
- Market odds: On Myriad (a prediction market), traders place roughly 73% probability that BTC hits $55,000 before it reaches $84,000 — sentiment that flipped bearish in early June.
- Technicals (weekly):
- Fibonacci retracement from the earlier $82,833 high points to $70–73K as heavy-activity zones.
- ADX: 30.7 — indicates a meaningful trend is in place; directional indicators favor bears.
- RSI: 36.8 — close to oversold but not yet there.
- Moving averages: The 50-week EMA is still above the 200-week EMA (the golden cross remains intact), but the spread is narrowing — a death cross on the weekly chart would signal a more structural shift.
- Bullish factors: Spot BTC ETFs ended a 10-day, $2.7B outflow streak with $221.7M in inflows on July 2 and have taken in roughly $510M since. On-chain Glassnode data shows long-term holders resuming accumulation. The Fear & Greed Index sits at 23 (“extreme fear”), a contrarian signal historically associated with buying opportunities.
- Bearish factors: Shorter-term price action failed to clear key resistance; ETF net flows YTD remain negative; Citi lowered its 12-month BTC forecast to $82,000 with a $53,000 bear case. Fibonacci downside near $57,735 is a visible technical magnet; Myriad wagers favor $55K first.
Ethereum: a weekly death cross and rising conviction to the downside
- Price action: Ethereum trades near $1,730, down about 3% on the week and more than 30% over the past year.
- Structural shift: ETH has confirmed a weekly death cross — the 50-week EMA has crossed below the 200-week EMA. That’s a meaningful long-timeframe signal and reflects structural deterioration beyond daily volatility (the daily death cross has been in place since November 2025).
- Market odds: Myriad markets price roughly a 72% chance ETH falls to $1,500 before climbing to $3,000; that probability flipped decisively in May.
- Technicals (weekly):
- Fibonacci retracement from the downleg defines $1,985–2,099 as active zones; current price sits near the $1,731.8 Fib level.
- ADX: 26.5 with bearish directionality — confirming a trend in motion to the downside.
- RSI: 36.9 — approaching oversold but not yet at classical buy-signal levels.
- Bullish offsets: US spot ETH ETFs recorded $29.1M of inflows on July 2. Historically, weekly death crosses on Ethereum have sometimes appeared near the late stages of bear cycles, and oversold readings have previously been attractive points for patient buyers.
- Bearish factors: US spot ETH ETFs had record outflow streaks in May (17 days, $401M) and again in June. Citi’s bear case for ETH is $1,094. For bulls to regain technical footing, ETH would need to reclaim the ~$2,000 area — a move of roughly 15.6% from current levels — which would require a sustained trend reversal.
Bottom line
The market is in a familiar phase: extreme fear, structural downtrends visible on weekly charts (especially for ETH), and strong odds in prediction markets that lower price points come before fresh highs. But the changing institutional landscape — spot ETFs, broad adoption and new regulatory clarity — makes this cycle different from previous ones. That may affect the timing and shape of any bottom. For now, indicators suggest selling pressure may be nearing exhaustion in spots, but not yet finished.
Disclaimer: This summary is informational only and does not constitute financial or investment advice.
Read more AI-generated news on: undefined/news